VST - Sell
ST - Hold (Buy since April 18th, 2012)
IT - Bull (Buy since Nov 27th, 2012)
LT - Bull (Buy since Nov. 2011)
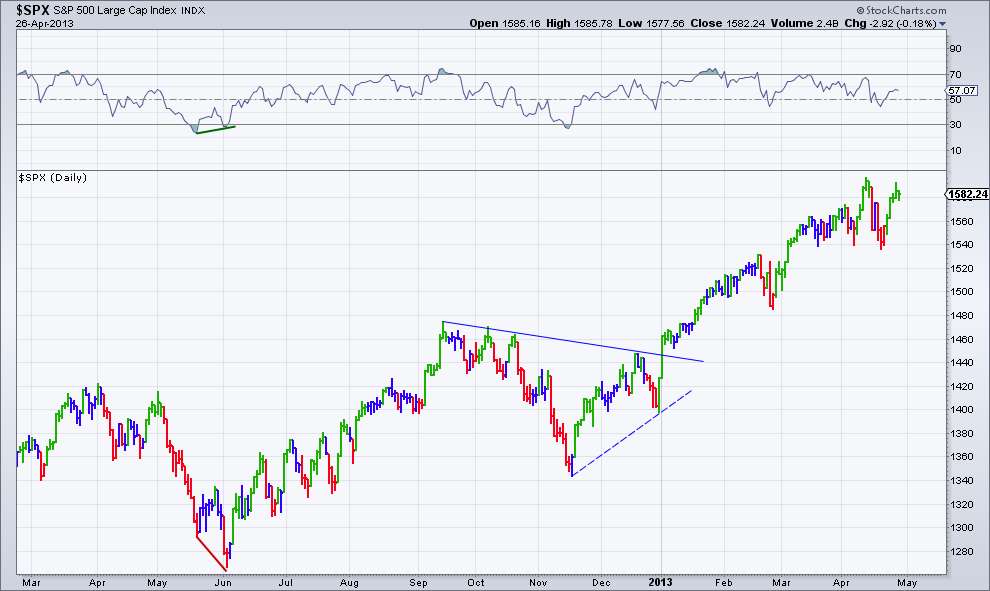
We should see ST signal to sell in the next few sessions. Just FYI, that triangle breakout at the beginning of this year should take us to a target of 1620 $SPX.