Wednesday, December 26, 2012

ISRG update

Posted this on 12/20th . No change in stance, risk is to the downside. Holding short right now with stops. Current chart below on a weekly period, hence patience is required.


Friday, December 21, 2012

Gold miners

I short Gold miners via being long DUST. DUST is 3x bearish Gold miners ETF. I bought DUST at $27.90 and I am holding it as of now at 35.51$. I monitor my DUST position using GDX charts. I would be out of DUST on the break of my 17 EMA (indicated by "A" on the chart). I would consider buying a small amount of GDX on the 1st trendline break, for trading (short term). I would really consider investing (means holding in Intermediate/ long term) only on a trendline break above the 3rd trendline. Till these breaks happen, hold the shorts on GDX.

Click on the chart for bigger view


All 3x instruments should be considered trading tools only, 3x instruments should never be considered "hold" instruments or investing instruments. It is also prudent to have a stop/ stop loss on all such instruments. Good luck to you!


Thursday, December 20, 2012

Line in sand

Lol, I was typing this message with "lines in sand" chart but the futures puked down to /ES 1392. Well, currently /ES stands at 1418. Remember the flash crash in 2010? The lowest level on that day will be tested later. In other words, sell the bounce in the short term. No TA here, simple common sense. Now that you know we will visit 1392 again, get ready for it. 1417 is the current support level but that will be broken eventually in the coming days. I am looking at the hourly chart here but closing price on the hrly is important as well.

Tomorrow is OPEX, so if I was short I would ring the register at least on partial positions because OPEX days harass both bulls and bears equally.

These types of "crashes" also teach us not to be short options, though they may be fat tail risk events. Accounts will be wiped out in an instance.  


ISRG

Currently no position. I shorted at 537$, posted live tweet on stocktwits. I covered at 495$. The ticker broke the trendline on high volume and is staring at the long term trendline where it will find the bottom. Why did I take the profits? I rang the register because I rode the ticker down 8% in just 24 hours. It could still go down but taking profits is healthy for the account. I expect the ticker to go up, kiss the trendline and back down again.


Gold update

I am looking for a bounce here at this level. However, the damage is done. Sell your short term positions on any rally because we are going lower on Gold and silver. Intermediate and long term positions are still good. 


Saturday, December 15, 2012

AAPL update

Andy Zaky and Cody Willard who loaded on AAPL calls at 700$ and then 650$ on margin are as good as dead now from loading up to their gills. While Andy Zaky's last public post came on October 23rd, Cody Willard is now seen answering questions about the fundamental big picture on marketwatch like he is some expert on market fundamentals. Lol. Few days ago, I was having a conversation with a stocktwitser and he was saying Andy Zaky made a lot of money on AAPL in the last few years. Yes, they were rewarded from AAPL's long run for a long time by getting lucky but they frittered it away. Both levered it up many more times than they actually can, bought options on margin. Word on the street is Zaky is now unofficially bankrupt. People like them will continue to load it up on both stock and calls as the AAPL plunges and will get delivered by a big shaft named AAPL. They had no clue while it was going up, they will have no clue when it is going down. Every Tom, Zaky and Cody will be right in a bull market. It is them who survive the bear markets finally make it to the end. Zaky and Cody are not one of them.

Exactly when AAPL hit a generational low (sarcasm peeps), I posted this . AAPL rallied hard and then hard till 590$, everyone who proposed the generational low thought I was wrong.  If you read that blogpost well, I said there will be violent moves in both directions, long and short. I said fortunes will be made and lost. AAPL is a stock that cuts both longs and shorts. It has been that way forever, and it will continue to be like that. If you check market action of AAPL in the long time, between peaks and bottoms, you will find that it often cut itself into 1/2 or then double again. For example, in 2008 from 180+ to 110$ and then again to 180+ and then to bottom at 80ish. These type of moves happened even when the stock was in the teens. These will happen even now, except the volatility has risen now much more. Big gap downs and gap ups seem common. Most of the traders have no clue which way it goes. I have been making good money off of it, but I rarely hold overnight, mostly by trading intraday. I don't want to keep a loaded gun in my pocket while I am asleep, nope. Traders have no clue, then investors don't have any idea what investing is. Yes, some of them have made 1000%+ gains in the last decade but what is the use if they don't make it to the bank. They are clinging to their positions thinking that the fundamental big picture is excellent. Apple as a company will be here (I hope so!) in the next 10 years just like Microsoft but as a stock it will underperform in the long run now. Law of averages will catch up eventually. 

I am still clinging to my 'generational low' post even now. We are yet to see a bottom in the intermediate term. The gravity is too high and the stock cannot sustain here. New intermediate lows are coming. My only hope for the bulls is for the stock to bottom in the 490ish range where the monthly 20 MA sits. Of course  the bottom would not complete till the ticker hits 430ish. But, first 490$, then upside and then again start the move lower. That will kill both longs and shorts, get it? Yep, bear markets kill both bears and bulls because moves will be violent in both directions. That is why market veterans ask us to be in cash in bear markets, and they are true for a reason. That is it for now on AAPL.
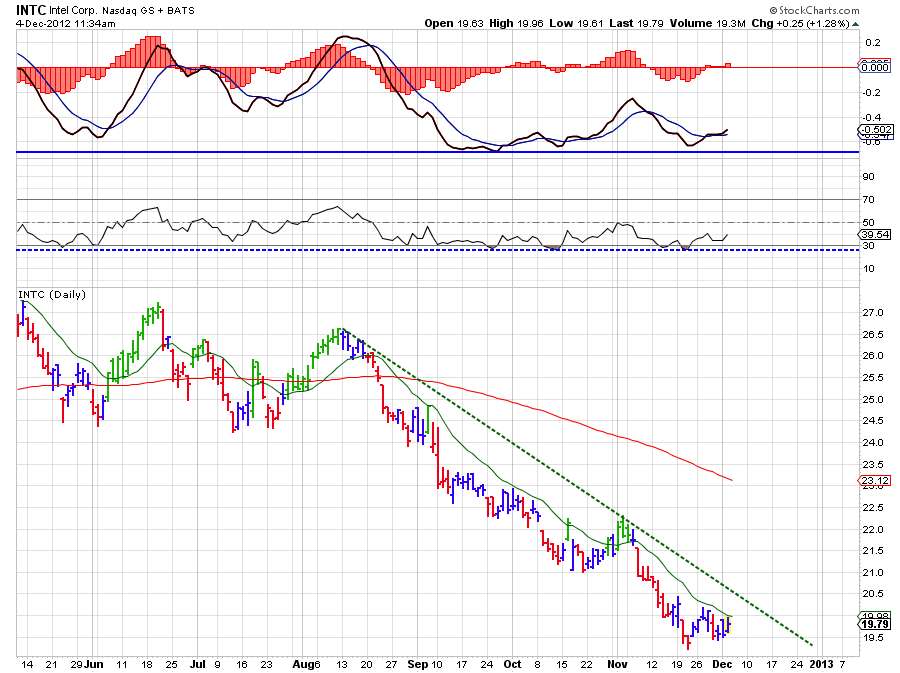
Market update:

VST - Bearish
ST - Bearish
IT - Bullish
LT - Bullish

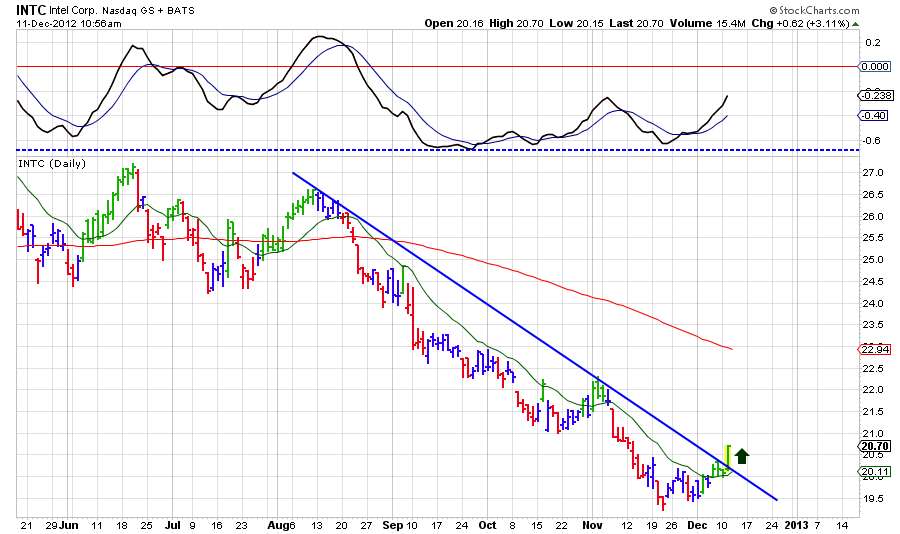
Use SPY/ DIA to play my market updates. QQQ is out of sync due to the AAPL fiasco.


Tuesday, December 11, 2012

Market update


The market has been waiting for some "crucial news" from the fiscal cliff talks and then tomorrow's FOMC announcement. The transportation index has been in a box for over 6 months now. Which way does the market go depends on the DJT moving up (breakout) or down (box trading again). I am watching this as we trade the markets. Currently, my targets are almost achieved on the VST and ST. I am neutral on these timeframes now. I am bearish on the Intermediate term. I am bullish on the long term of this market.


Update on Intel Corp.

I posted this chart few days back on my buy on INTC. Now, INTC broke that downtrend line. Holding long and strong with a 1st target of 23$. Stop at 19$.
Visit StockCharts.com to see more great charts.

Saturday, December 8, 2012

Bombay stock exchange

The BSE has run over 8% in the past 20 days and is over extended. The market is trading on negative divergences here. While I envisage that this market will reach a peak by April - June 2013 and then down from there into 2014, my short term view is bearish. This market needs to correct here in order to go further up. I expect the market will find support at the 50 DMA to take pause. Charts of Indian ADRs also show the same TA, divergences all over. My recommendation is to sell short IBN, HDB, EPI, IFN in the short term. HDB and IBN are Indian bank ADRs while EPI and IFN are ETFs based on the BSE/ sensex. 

Visit StockCharts.com to see more great charts.

Friday, December 7, 2012

Tuesday, December 4, 2012

Weekly NFLX chart

Bigger short squeezes coming.....on capital gains covering! Long from 83$.
Visit StockCharts.com to see more great charts.

Intel corp.

Bought INTC here at 19.7$. You can buy the breakout of the green trendline.
Visit StockCharts.com to see more great charts.

Shanghai composite index

Shanghai composite index is showing a positive divergence in the Intermediate term. A break above the trendline can be bought. Remember this is a weekly chart, so it may take few more weeks for the breakout. Be patient! You could buy FXI to trade $SSEC in US markets.


Monday, December 3, 2012

Saturday, December 1, 2012

The big picture


The long term trendline of $NDX from the lows of 2009 is still intact. There was an attempt to break the line on 11/16. The index dipped below the line but closed above it. The momentum is waning with all the indicators posting lower highs. But, if you are a long term investor, you could wait for the trendline break and then a 5% stop below the break, to exit.

Even after the trendline break, there will be attempts to rise above the trendline again. All this may take few months time. Topping is a process as you all know. I see $NDX topping in this short term at 2725 - 2750 but then there will be several attempts to regain the momentum. In other words, we could see a range bound market for the next several weeks.

Either way, long term investors have no reason to get out right now. If the momentum is very strong, we may even rise above the 2012 peak. There is a very small possibility for this to happen, but there is!

My previous big picture call was posted on September 3, before the market peaked few days later. So far as long as the market doesn't rise above it, it remains the top for this market.